Instate vs. Out-of-State Admission Bias
- George Fane

- Jul 31, 2019
- 4 min read
Updated: Aug 31, 2019
State universities often are established by the state, receive funding from the state, and have a justifiable bias in admitting residents of the state. How significant is that bias?
Method
As explained in the article College Admission Rates, I believe both reported acceptance rate and average SAT score must be considered to determine an undergraduate school's difficulty of admittance. To find the bias in some state university's admittance of instate versus out-of-state (OOS) applicants, both instate and OOS admission rate and average SAT score must be reported.
Out of all public Ivies (which include the College of William and Mary, Miami University, and the systems of California, Michigan, North Carolina, Texas (UT, not A&M), Vermont, and Virginia), the four data points could be found for the California, North Carolina, and Texas systems, which fortuitously contain four of what are considered to be the top five public universities: UC Berkeley, UCLA, UNC-Chapel Hill, and UT Austin.
Unfortunately, the University of Michigan, my state's system flagship and perhaps the school I was most curious about, only provides overall acceptance rate and average SAT score without specifying for instate and OOS applicants.
Results
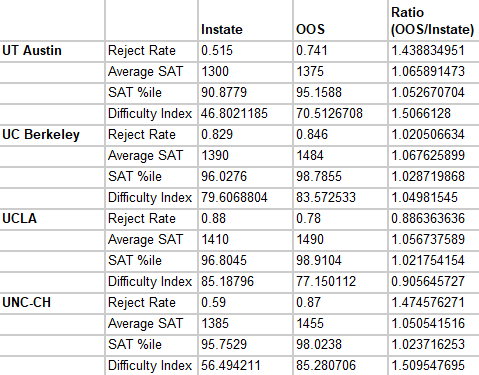
First, I gathered the four data points: Instate and OOS Acceptance Rate and Average SAT Score. Reject Rate is one minus Acceptance Rate, and SAT %ile is the percentile of SAT takers able to achieve the listed score according to PrepScholar. I then multiplied Reject Rate with SAT %ile to calculate the Difficulty Index Score (DIS).
*Average SAT Score is that of admits or enrolling students. Ideally, I would use average SAT of applicants, but most universities don't provide that information
**The Difficulty Index neatly ranges from 0 to 100. 0, the score of a non-selective school, would indicate either no rejections or an Average SAT Score of 400, the minimum. An obscenely selective school with an index of 100 requires applicants to have a 1610 or higher and will only admit one of them (I'm joking, of course, but the description is a way to grasp the impossibility of getting into a 100 DIS school).
***I'm a little proud of the UT Austin calculation. On the site, it provides Acceptance Rate and Average SAT Score of Automatic Admits and non-Automatic Admits but not of instate admits as a whole. Using some algebra, I can now tell you that 36% of instate admits are automatic while 64% are not. With that information, I calculated a weighted average of instate applicant SAT score.
The Ratios of OOS to Instate DIS are somewhat surprising; compared to instate applicants, UT Austin seems only 50% harder to get into for OOS applicants, a vast majority of whom are automatically deferred. Additionally, Berkeley seems only 5% harder to get into OOS vs. instate. Most likely, OOS applicants for very well-regarded schools self-select, and some public schools focus very strongly on educating their own states' populations, causing higher DIS Ratios and lower Average SAT Scores.
The graph below contains each school's Difficulty Index information
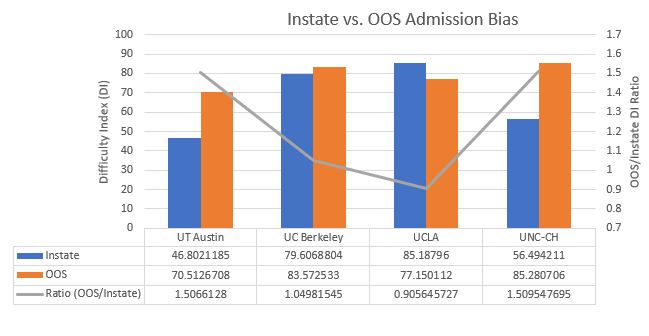
*I constructed this graph in Excel, which seems much more intuitive than Sheets at building combination charts. The table at the bottom very nicely serves as x-axis labels, a legend, and data labels all without cluttering the chart (placing that table may be an option in Sheets, but I didn't find it).
However, calculating each of the 4 universities' relative SAT takers (RST) per admit (the method used in the first College Admission Rates article) yields this chart:

This aligns more with existing perceptions of bias, in which gaining admittance to flagship public schools is much more difficult when applying OOS.
Where Should I Apply?
RST can ease the decision when a student chooses which schools to apply to. Quality of a school can be linked to its overall selectivity, or Average RST (x-axis) of both instate and OOS. Difficulty of admission can also be determined by Specific RST (y-axis), which accounts for the difference between instate and OOS applicants. For private schools (like Cornell, below) that make no distinction between instate and OOS, Average and Specific RST are the same.
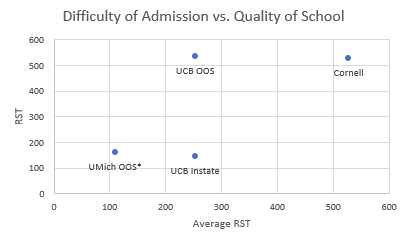
*I could not find the average SAT score of UMich OOS applicants, I multiplied the average score by OOS acceptance rate. For the purpose of this thought exercise, I was forced to choose a public school with a similar OOS admission difficulty to UC Berkeley Instate. My approximation of OOS UMich's RST was the closest.
By the chart above, If I am a student in California who applies to UC Berkeley, then I should not apply OOS to UMich, which has about the same selectivity but less than half the quality according to Average RST. Furthermore, nearly every place OOS will cost more than Berkeley to me.
If I am not a student from California and want to apply to Berkeley, then I should not do so; I should apply to Cornell instead, which has twice the quality and slightly easier admissions based on RST.
*My calculation of RST for Cornell has a similar issue as for UMich: Cornell may have different average SAT scores for instate and OOS applicants, because Cornell is partially publicly funded and may prefer residents of New York state. I also cannot find different acceptance rates for instate and OOS, if they exist at all.
This thought exercise supports the idea that a student's best interest is to apply to their state's public schools and apply OOS not to other public schools of comparable quality, which will be much more difficult and expensive to attend, but to schools like those in the Ivy League, which admittedly are equally, if not more, difficult and expensive to attend, but have superior quality.
Thank you for reading,
George Fane
Works Cited
CAR Spreadsheet:
https://docs.google.com/spreadsheets/d/1qcO4dykOs4c-XkX1bOYQPgnsnRQsGtZzoXBkV4mKeWI/edit?usp=sharing
I first compiled instate and OOS acceptance rate and SAT score data in this spreadsheet. It also contains links to the sites from which I collected information:
Percentiles for SAT scores:


Comments