UBI and Income Distribution
- George Fane

- Nov 7, 2019
- 5 min read
Updated: Nov 26, 2019
Just between the end of my sister's sophomore year in college and the beginning of her summer research program, our whole family went out to a lovely little Japanese restaurant. Over bowls of steaming udon and delicious sushi, Lauren told me about her new roommate's love for Andrew Yang. His universal basic income (UBI) is a nifty idea, Lauren said (or something similar; I'm paraphrasing). Perhaps you should write about it in that website of yours. As I thought about UBI more, I realized that the large point of contention over any policy is who pays, which directed my interest as well to American income distribution as it stands today.
Thought Process
I think of government spending as a single item (even though it isn't): everyone pays some amount in tax but receives $1000 per month. Let's consider net benefit per person. Net benefit would be positive for the lower- to middle-class, who deserve social benefits, and negative for the rich, whose incomes should be transferred away to people who need it. The way I see it, there are only two points on the income spectrum where it is fair for net benefit to switch from positive to negative.
The first point is at the income where all people earning less than that amount do not have enough to survive. For this bare-bones plan, it is useful to model the effects of UBI similarly to the way I modeled negative income tax:
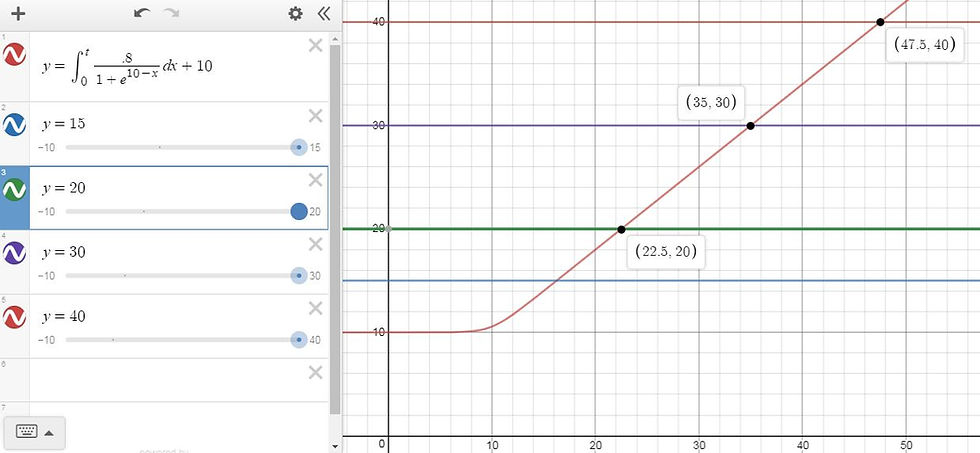
The x-axis is pre-tax income, while the y-axis is post-tax. The most severe distortion caused by UBI is at the very low end of incomes, where all would receive the same total amount post-tax. People at higher incomes would bear more and more of the UBI's tax burden. In our fictional country with double-digit incomes for the sake of modeling, people earning $22.5 pay a net $2.5 for the UBI, while those earning $47.5 pay $7.5.
The second point (SP) where UBI net benefit could justifiably switch from positive to negative, which intrigues me more, is point at which the sum of all American incomes above it equal the sum of all American incomes below it. This is in line with the oft-repeated phrase that "The top x% earn as much as the bottom xx%". If the SP system is used for UBI distribution, the exact income where sum above equals sum below must be found.
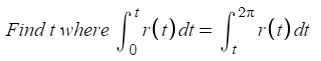
This guides our attention to current American income distribution. In Calculus BC we learned a relevant technique relating to polar curves, used to find the line t that would split a curve's area into two equal parts:
Income Distribution
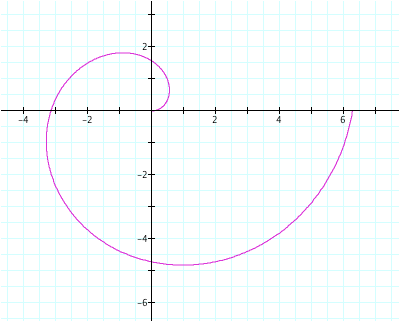
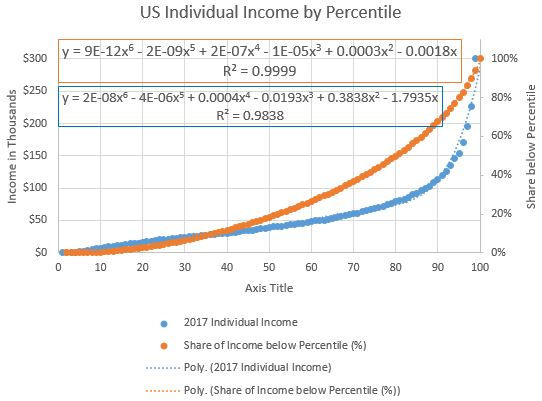
Now that we have our mathematical toolset, we need real income data. DQYDJ nicely displays the income at each income percentile; converted into a chart the data look like this:
To find the income percentile where all those above earn the same amount as all those below, the sum of all incomes below each percentile can be calculated and compared with the sum of all incomes utilizing the displayed formula:
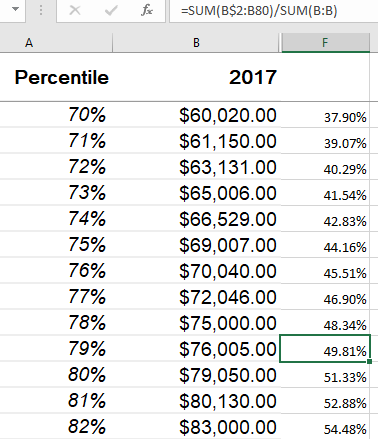
As you can see, the rough midpoint is at 79%. People in the 80th percentile above earn as much as those below the 80th percentile. In other words, the top fifth of America earns as much as everybody else.
Excel's regression feature gives lines of best fit:
Gini Coefficient
It turns out that Share of Income is important in calculating the Gini Coefficient (GC). It is 0 for perfectly equal societies in terms of income and 1 for perfectly inequal ones, where a single person has all the income and everyone else earns nothing. The GC is calculated by doubling the average of each percentile minus its corresponding Share of Income:
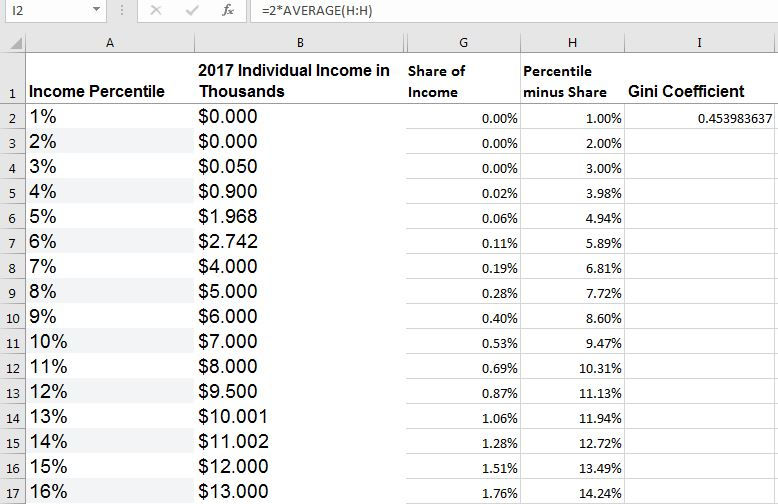
The formula at the very top gives a Gini Coefficient of .45, on the image's right side. It is not the best out of all highly-developed nations.
Current Federal Income Tax
The federal income tax brackets were very confusing to me when I first saw them in elementary school. I thought that once a person jumped from one bracket to a higher one, their entire income would fall under the new bracket's rate. To me, this meant that earning more money pretax could result in less money after tax than before. I even asked my parents at one point if people who earned a bit above the upper limit for one bracket asked their bosses for a tiny pay cut, just so they could keep more in their pocket each year.
Obviously, I was wrong. I bet, though, that if you give something like the below chart to some kids and tell them to figure it out, they'll be as confused as I was:
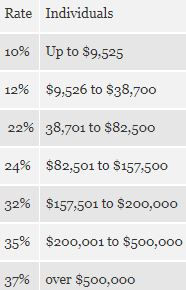
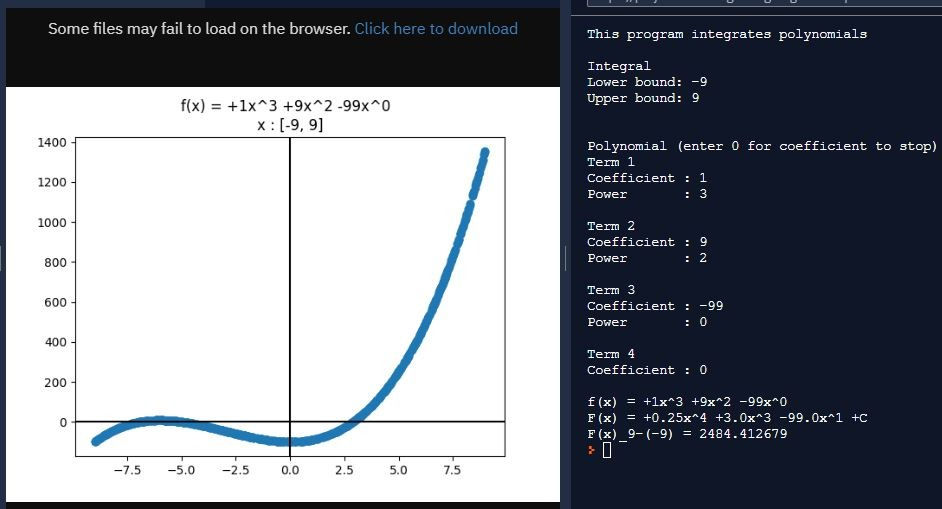
Even though I understand how federal income tax works now, I still wish there was a single, simple function that outputs tax owed once income is plugged in. So I made one.
https://onlinegdb.com/ryeIAHziB
It starts with a program to generate income tax owed for $1,000 increments. The for loop condition accomplishes that increment and stops the loop under 666 thousand dollars.
Note: when I create upper limits I like to type only one digit. That 666 is not a Satanic reference by any means.
I then stored the tax brackets in the array limit and stored the corresponding rates in the array rate. Those two arrays form the main part of the formula that outputs tax owed based on income. I also manually calculated the exact tax amount at the low end of each bracket and stored the values in the array owed. This I include in the formula to make it a touch more accurate.

To the left side is an example output of my program. The image contains the last several tax amounts in thousands of dollars, corresponding to, starting from the bottom, 665 thousand in income, 664, 663, and so on.
Copying the output and pasting it into a spreadsheet yields the below chart:

Even in the graph we can see that the tax amount is composed of several straight portions, not a single curve. A regression gives us one, though, which we can view at the top of the image. A second-degree polynomial has a quite good 0.999 R-squared value.
I questioned the negative y-intercept at first, but it isn't a bad idea. It falls in line with my appreciation of negative income tax. Those with no income would receive about $7,220 annually from the government, just over half of the payment under Mr. Yang's UBI. That amount is not enough to live on, but is a start towards better redistribution.
John Oliver compared income inequality to cinnamon: “You definitely want to have a little of it to spice life up a bit, but too much of it can be very dangerous.” America struggles with inequality every day, but innovative policies like UBI or negative income tax can help with a cure.
Thank you for reading!
George Fane
Income by Percentile: https://dqydj.com/united-states-income-brackets-percentiles/

Comments