Negative Income Taxation
- George Fane

- Apr 4, 2019
- 3 min read
This policy can ensure that everyone has the means to survive.
Imagine a graph with the x-axis labelled annual household income and the y-axis labelled amount in dollars.
Negative Income Tax
If America had only a negative income tax at the low end and no tax at all other points, my income function I(x) would have these limits:
I(x)=The minimum income after the negative income tax
x->0
and
I(x)=x
x->infinity
Therefore,
I`(x)=0
x->0
and
I`(x)=1
x->infinity
*The little mark (`) by the capital I means the first derivative.
I`(x) would look like this:

*The 10 in e^(10-x) is arbitrary. I chose that number so that the function would be nearly 0 at x=0.
Integrating the screenshotted function gives this graph of I(x), the actual household income per dollar earned:
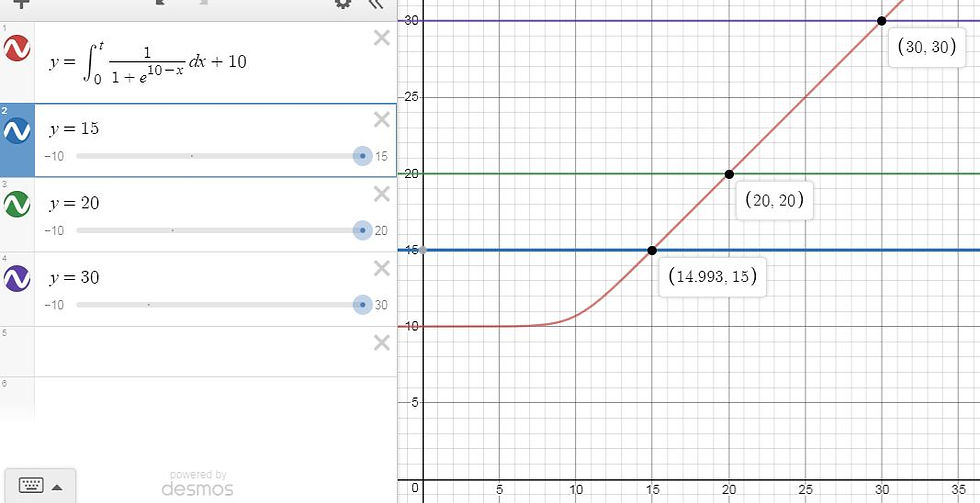
As you can see, income never drops below 10 due to the negative income tax. As incomes grow greater, the negative tax's effect drops off. You can see that $15 earned after tax on the y-axis is corresponds to slightly less than $15 earned before tax, with a tiny addition from the negative income tax. The higher incomes of $20 and $30 have negligible additions.
*I added 10 to the integral of I`(x). Otherwise, the integral would be 0 at x=0. If I(x) has the form of
I(x)=Int 1 +c
1+e^(b-x)
as shown above, then b must equal c and both must equal desired minimum income. This way, pretax and after-tax incomes equal each other at higher incomes, meaning a dollar earned is no more than a dollar earned. However, that form for I(x) only works if higher incomes have a 0% income tax rate.
To find the actual tax rate, I subtracted after tax income from pretax income and divided it by pretax income, giving this curve:

After $20 of income, the tax rate is negligible. At $10, the household would get nearly 7% from the government, while at $5, the income would more than double.
Negative Income Tax coupled with Flat Tax
Let's say they have a 20% flat tax rate. I tried replacing the 1 in the numerator with 1-20% or .8 or 4/5, but the function did not work properly.
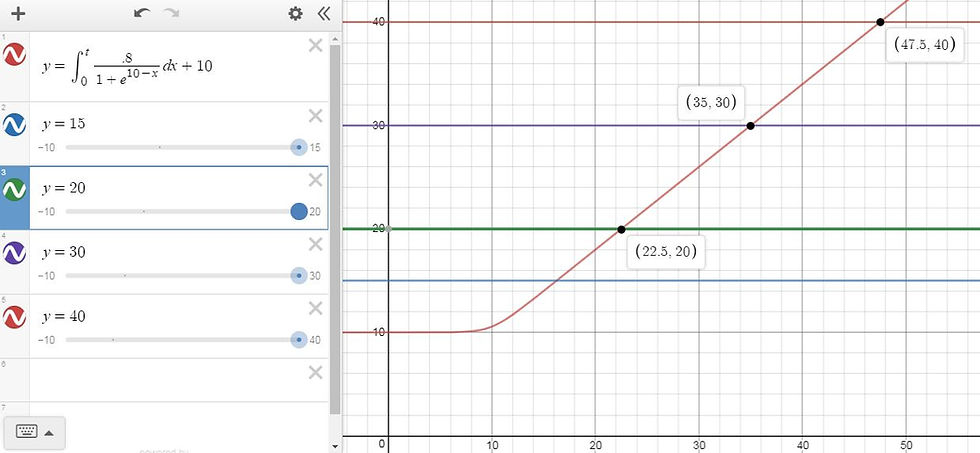
Instead of giving the proper y=(4/5)x, the function gave fractions of 8/9, 6/7, and 16/19. To include both a negative and a flat income tax, the function must be piecewise.
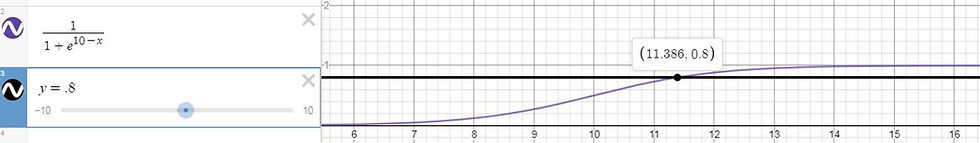
I simply graphed I`(x) and the slope of my flat tax function (4/5 or .8) and found the x value where they intersected:
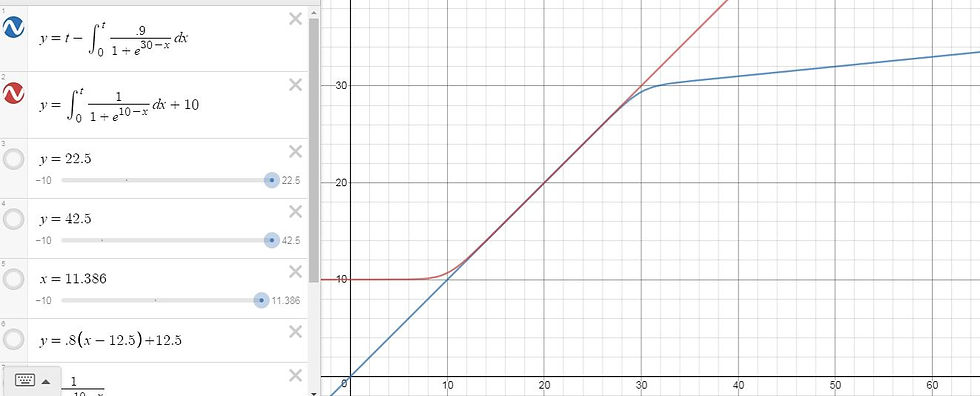
I then graphed I(x) and F(x), my function for income after the flat tax:
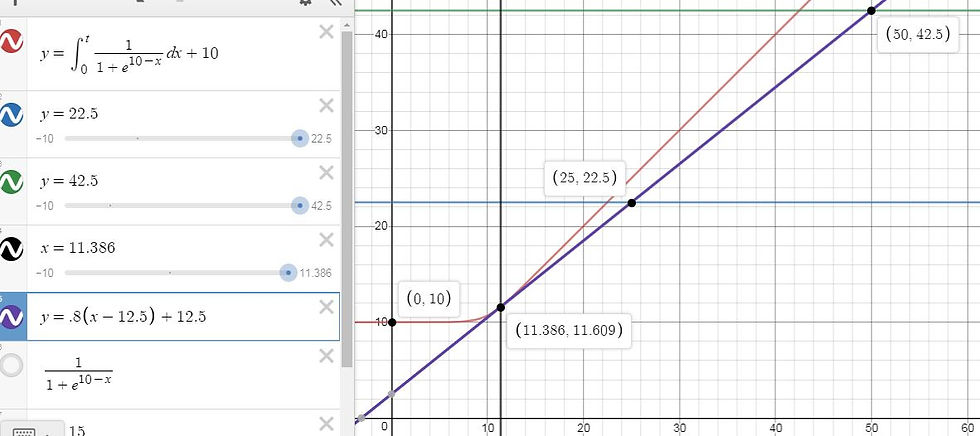
At and before x=11.386, regard I(x), the red line, for income after tax. At and after x=11.386, regard F(x)=.8(x-12.5)+12.5, the purple line, for income after tax.
*I originally had F(x)=.8x but it never made tangential contact with I(x). F(x)=.8x+2.5 made tangential contact, but the "+2.5" meant that the government gave everyone $2.5 after tax as a sort of universal distribution, which is currently uncommon. I framed the equation as y=.8(x-12.5)+12.5, which is the same thing but looks like a deduction ($12.5 is not subject to income tax). Coincidentally, if I scale up my graph and functions 1,000 times, that deduction is rather close to America's actual federal standard deduction ($12,000 for 2018)
**At x:[11.386, 12.5), the household indeed has a negative taxable income that should be multiplied by .8. This is necessary for F(x) to work properly.
Negative Income Tax coupled with Progressive Income Tax from Article 1
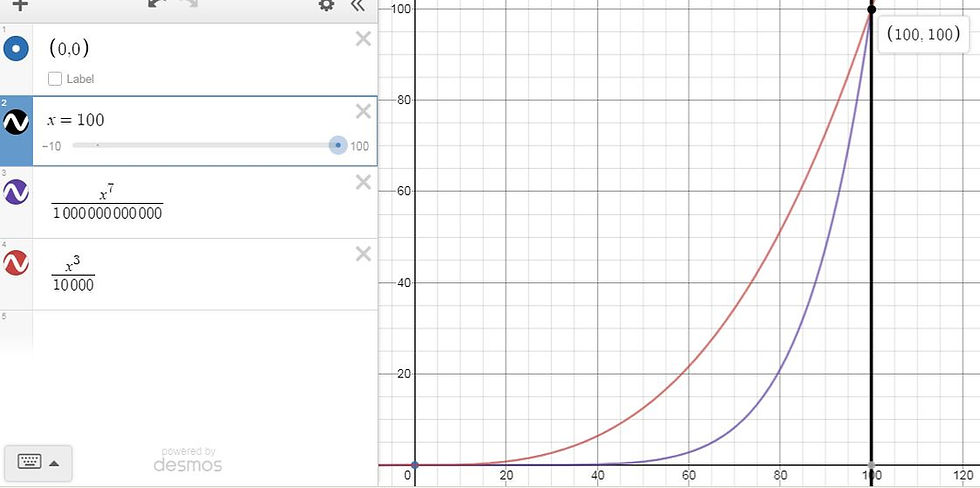
For Reference: Income after Ideal Income Tax from Article 1 (I'll name the function A(x)) entails no tax on low incomes, as shown in Graph 1, and a 90% income tax on high incomes, as shown in Graph 2.


Coupling these was simpler, because both I(x) and A(x) have segments with a slope of 1. I simply graphed both functions after shifting A(x) right and up 20 units, by changing A(x)'s e^(10-x) to e^(30-x). At and before x=20, regard I(x), the red line, for income after tax. At and after x=20, regard A(x), the blue line, for income after tax:
This curve shows the tax rates of the combined systems:

Ideally, the government should adjust these functions so that their segment of intersection includes most households, perhaps the middle three quintiles. An extremely progressive tax like Graph 3 helps the poor, hurts the wealthy, and leaves most middle-income households unaffected. Perhaps, the middle housholds should not keep 100% of their income as Graph 3 shows: perhaps only 80% (after a 20% income tax). However, I can adjust those functions another day. For now, I hope you enjoyed my rough modeling of the effects of a negative income tax.
Thanks you for reading,
George Fane


Comments